1/9 When nvidia-smi Goes Blind: Setting Up btop on DGX Spark
The Problem
Memory-Usage: Not Supported.
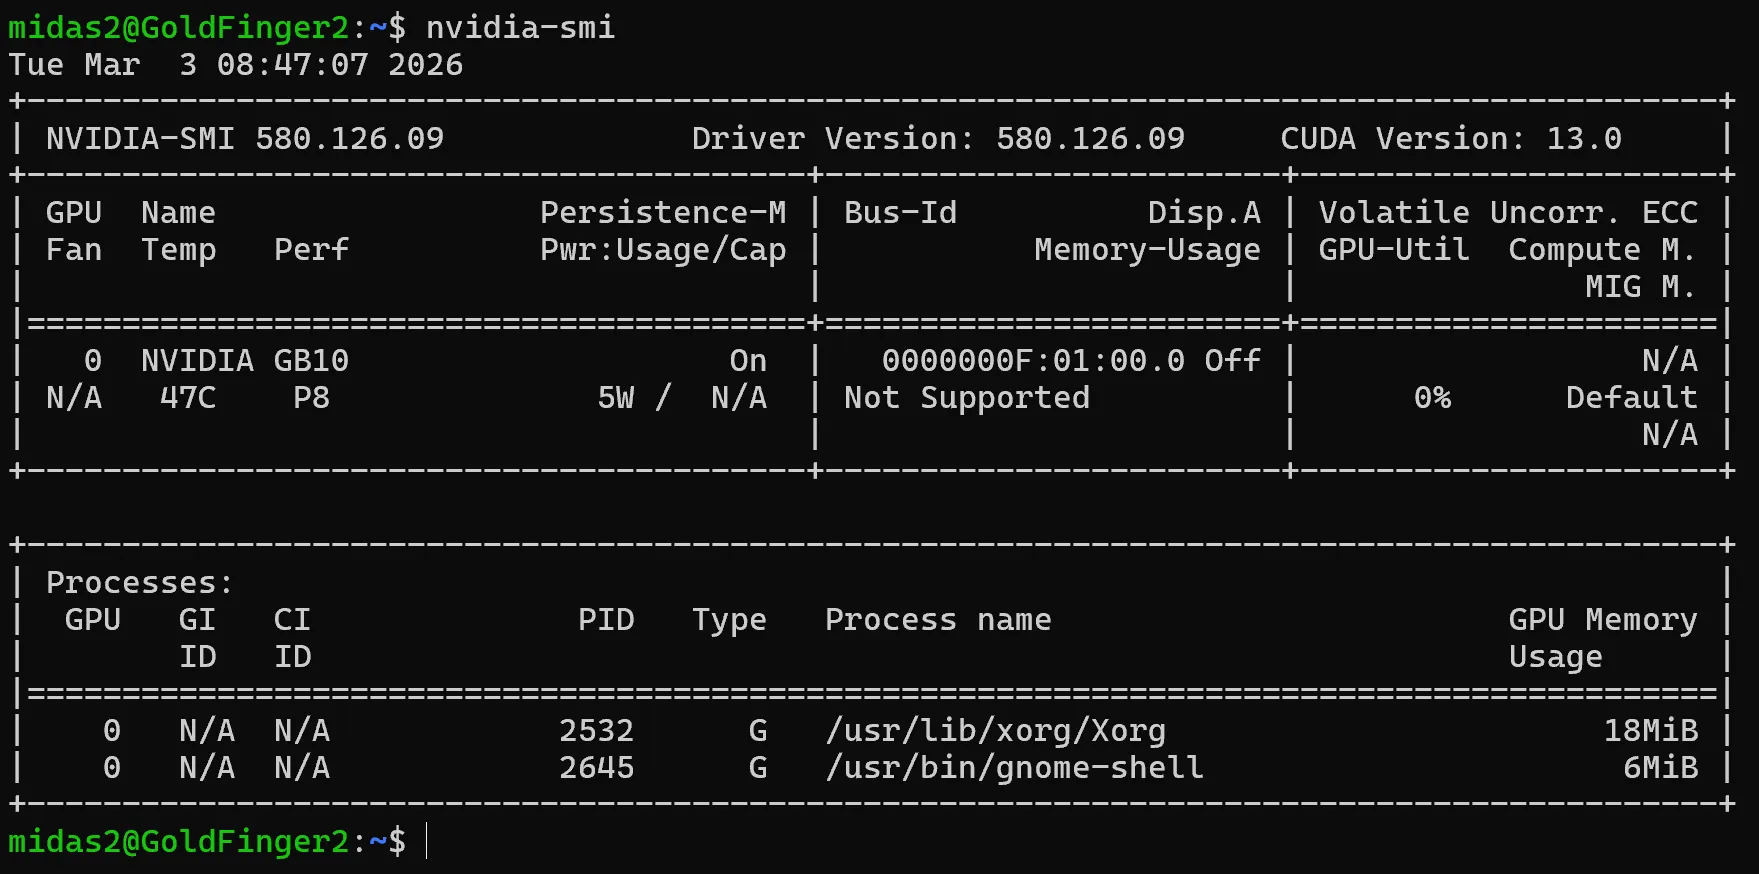
That’s what you get from nvidia-smi — NVIDIA’s own monitoring tool on your new shining NVIDIA hardware. Not “128GB unified.” Not “42GB allocated.” Not Supported.
The standard tool every ML engineer reaches for first — the one that’s been the universal GPU dashboard for a decade — is completely blind to the unified memory architecture on NVIDIA’s own consumer AI hardware. No memory utilization. No thermal breakdown. No idea how loaded the system actually is.
You’re flying a fighter jet with a bicycle speedometer.
This isn’t a bug report. It’s a pattern. New hardware ships. Tooling hasn’t caught up. The official channels don’t mention it. And the community fills the gap before the manufacturer does.
The Fix
madjakarta on the NVIDIA Developer Forums forked btop — the popular system monitor — and made two changes that NVIDIA hadn’t bothered with:
- Enabled GPU monitoring on aarch64 — the upstream Makefile hard-locks it to x86_64 only
- Refactored C++23 code to build on GCC 13 — which is what DGX Spark actually ships with
That’s it. Two fixes. Now you can see your GPU memory, utilization, thermals — everything nvidia-smi refuses to show.
How to Get It Running
git clone https://github.com/haven-jeon/btop.git
cd btop
sudo apt install lowdown
gmake -j$(nproc)
sudo gmake install
Launch btop, hit 5 for the GPU tab. Welcome to actual visibility.
Why Not htop?
htop will show you memory. It’s a solid process manager — lightweight, interactive, clean list of what’s running.
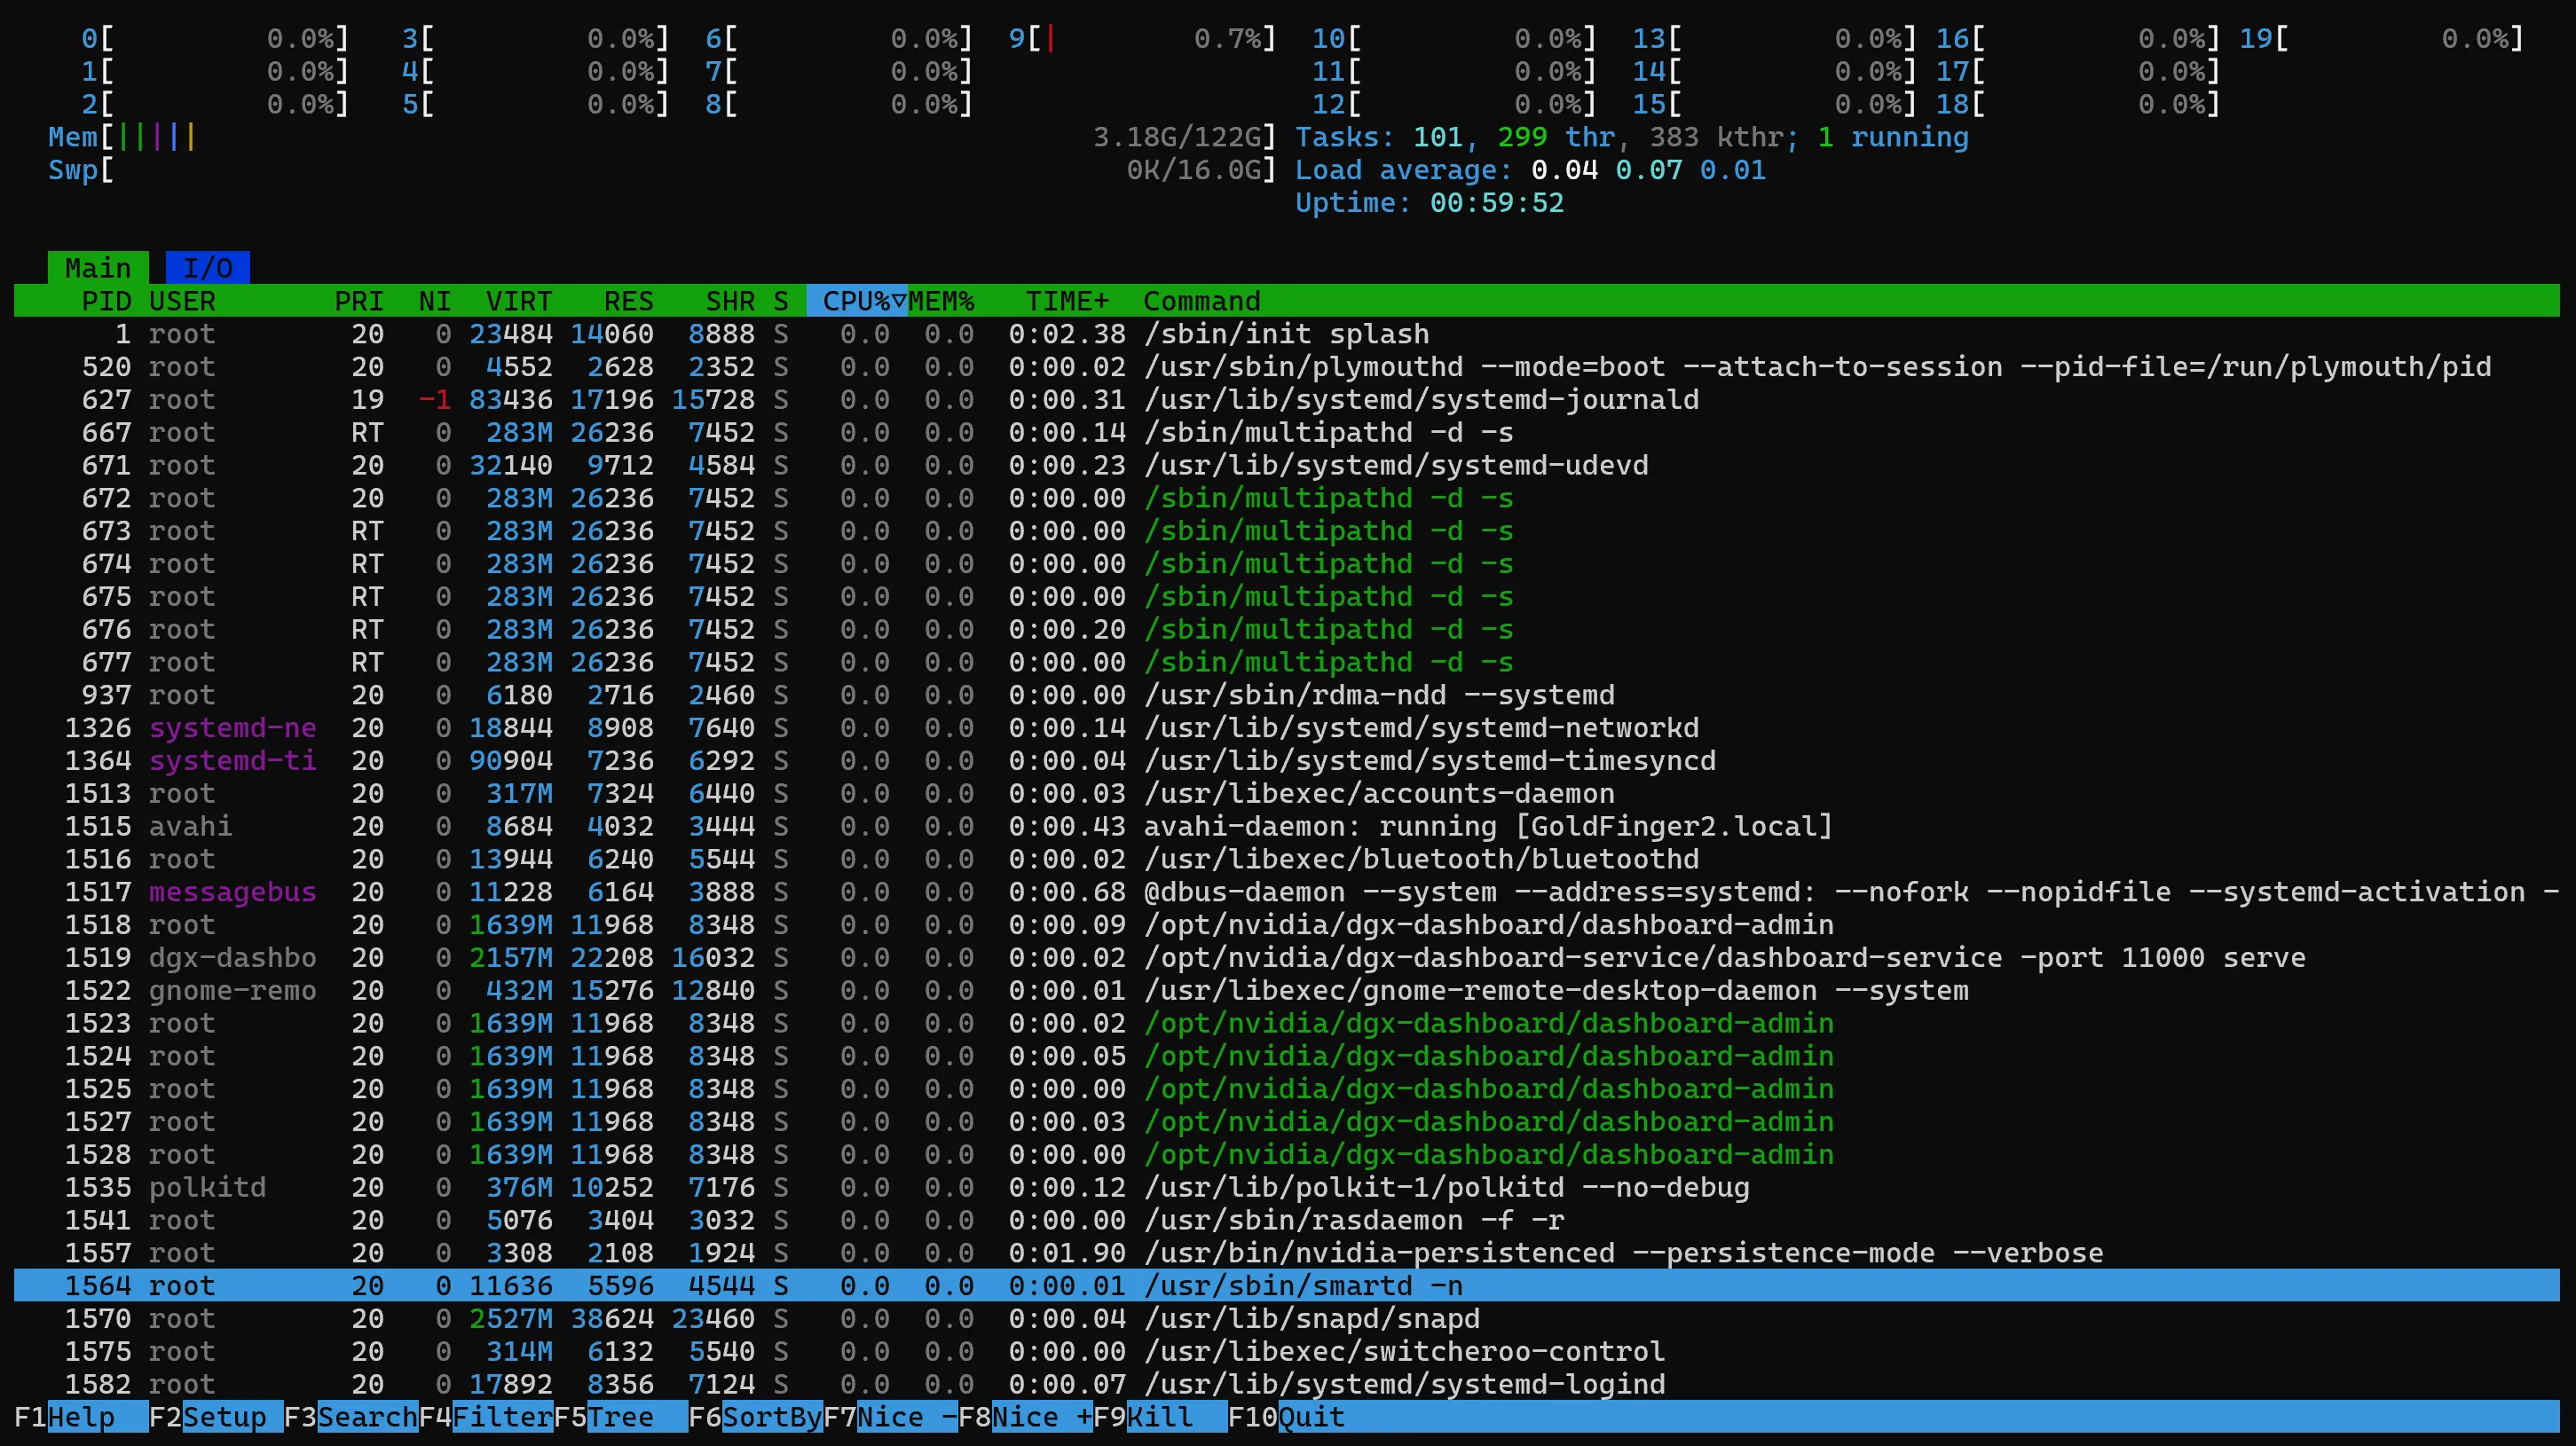
But btop is a different beast.
htop is a process list with some gauges. btop is a full system dashboard — real-time graphs for CPU, disk I/O, network bandwidth, all in one view. On hardware like the DGX Spark with high core counts, htop gives you a wall of individual core bars. btop handles it with a unified system load graph that actually tells you something useful.
The memory reporting is different too. htop uses a simplified calculation where everything adds up to 100%. btop reports values closer to how the Linux kernel sees it — cache and available memory overlap properly, which matters when you’re trying to understand how 128GB of unified memory is actually being used.
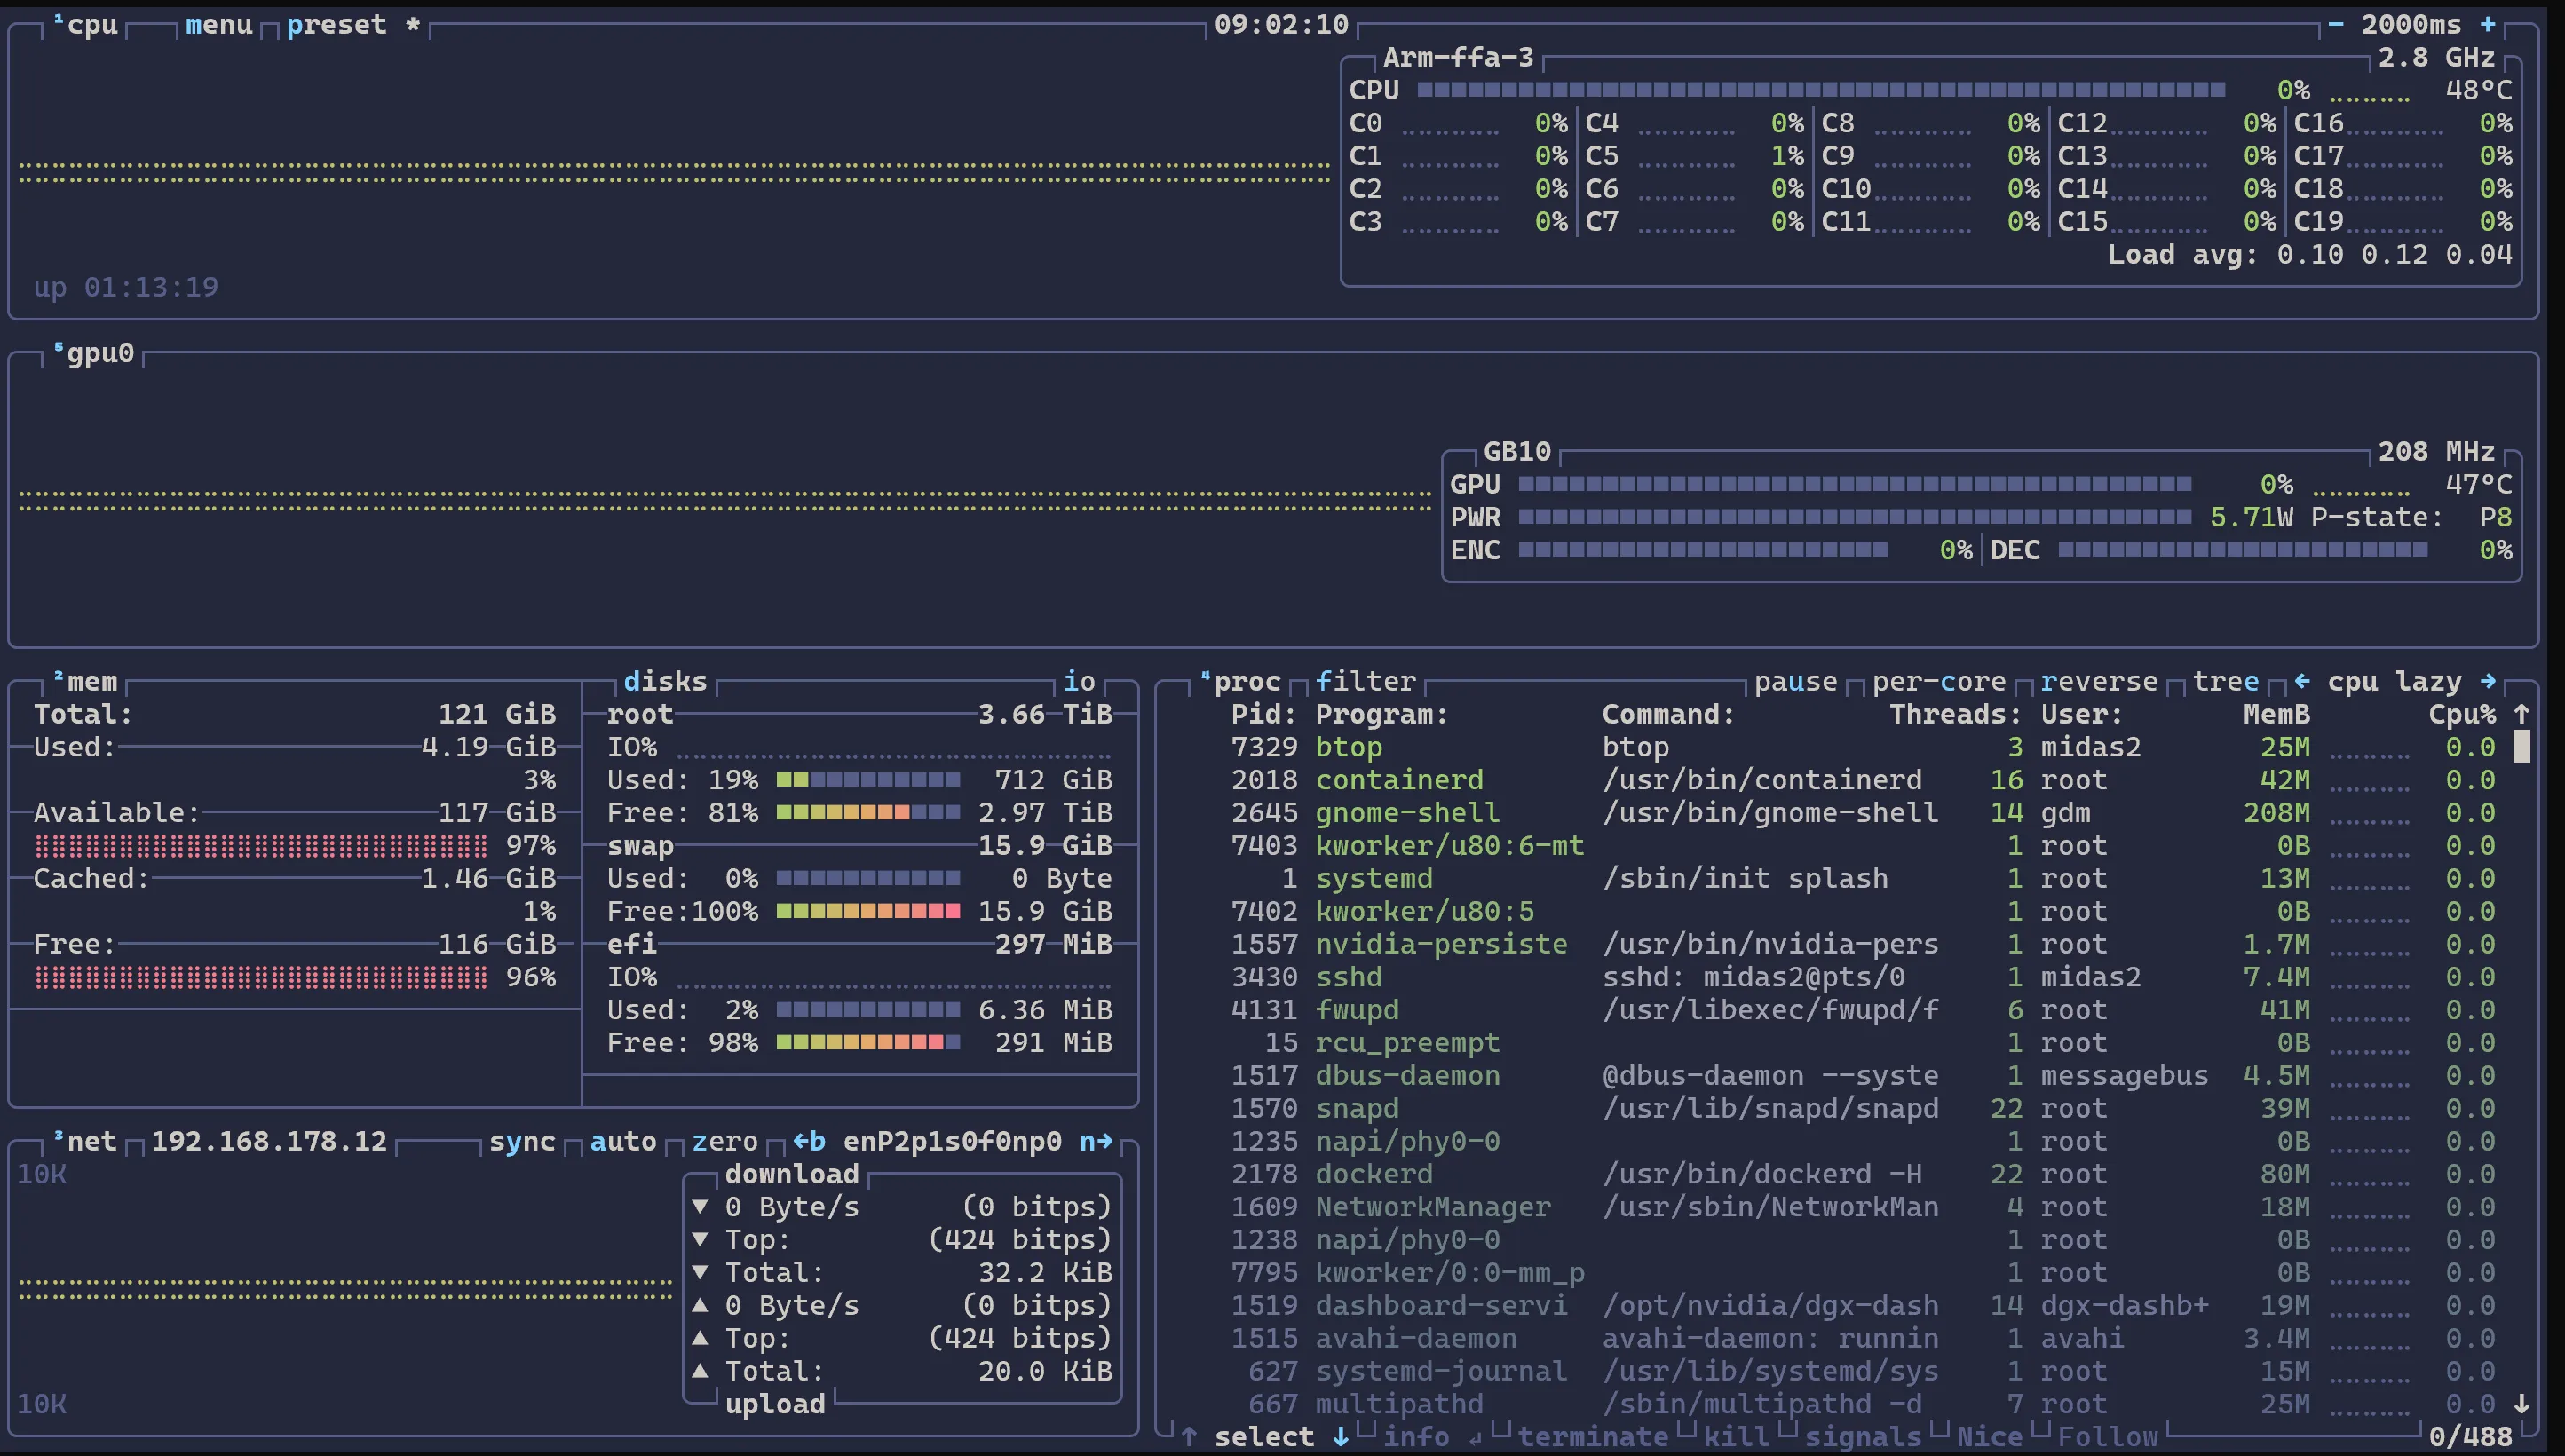
And the part that matters most here: btop includes integrated GPU monitoring when compiled with GPU support. That’s the whole point on a DGX Spark. htop can’t show you GPU utilization, thermals, or how loaded the inference engine actually is.
Written in C++, runs lighter than you’d expect despite the richer visuals. On modern hardware it’s often leaner than htop.
What btop Shows You
- GPU utilization and integrated GPU stats
- Unified memory usage (kernel-accurate reporting)
- Thermals and power
- Disk I/O and network bandwidth graphs
- Private cluster network traffic (if you’ve got multiple nodes on a 192.168.177.x network)
The Takeaway
The manufacturer tells you what the spec sheet says. The community tells you what the hardware actually does. Sometimes those are the same thing. Often they’re not.
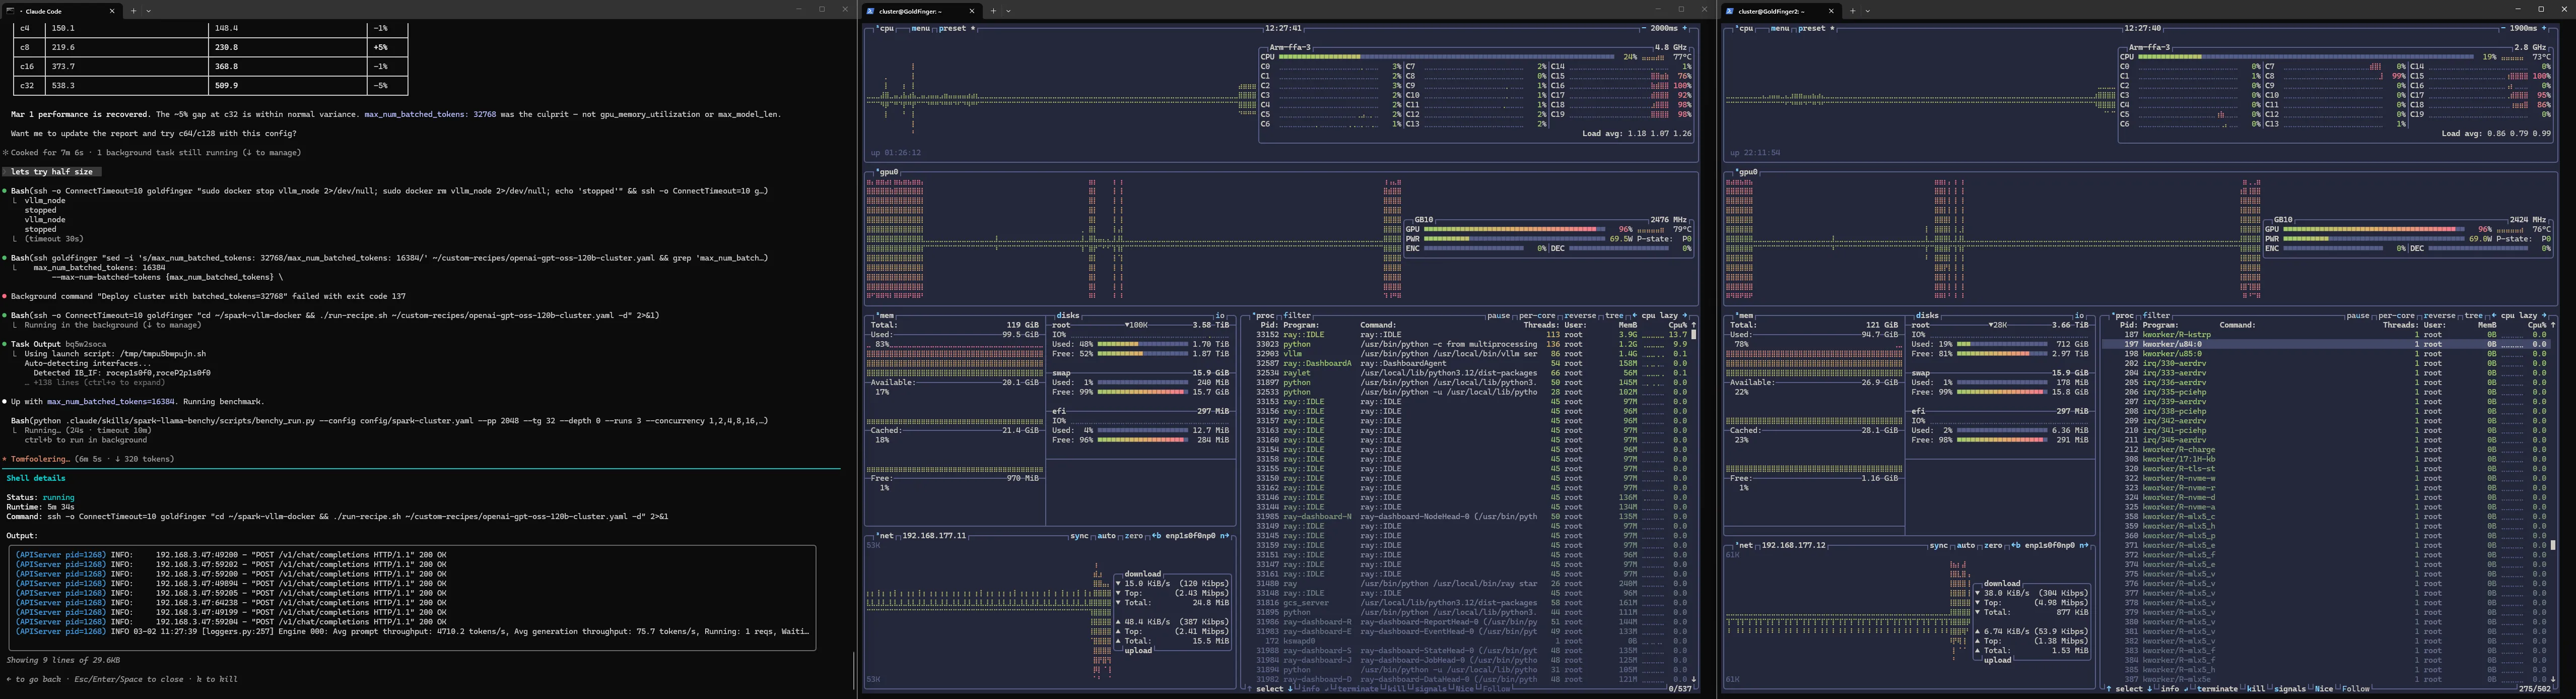
The full setup. Middle and right panels — Goldfinger and Goldfinger2 (yes, named after the Bond villain) — two DGX Sparks with live btop monitoring showing everything nvidia-smi refuses to: GPU utilization, memory, thermals, and the 192.168.177.x private cluster network traffic flowing between them. Tokyo-storm theme because life’s too short for ugly terminals. On the left — Claude Code with custom agent skills orchestrating benchmarks across both nodes. But that’s a story for later in the series.
Next: First Steps: Running Models on Ollama (20B → 120B) — from the boring 20B default to gpt-oss-120b at 40 tokens per second.