3/9 Switching to vLLM: From 40 t/s to 3,975 t/s
Previous: First Steps: Running Models on Ollama (20B → 120B)
Ollama is the starting line. Post 2 ended there — usable single-user inference, but no answer for “how many users?” or “how many agents?” That’s where vLLM comes in.
The NVIDIA Playbook — It Works, But…
NVIDIA had an official vLLM playbook for the Spark (build.nvidia.com/spark/vllm). Follow the steps, load gpt-oss-120b, get 40 tokens per second. Functional — but slow. gpt-oss-120b is a sparse MoE model activating only 5.1B parameters per token on native 4-bit hardware. 40 t/s felt like the hardware wasn’t being used. The community thought so too.
Why It’s Slow — The SM121 Problem
The DGX Spark’s GPU isn’t like any other Blackwell chip. Datacenter Blackwell (B200, GB200) is SM100. Desktop cards (RTX 5090, RTX 6000) are SM120. The Spark is SM121 — different compute capability, different instruction paths.
vLLM targets SM80, SM90, SM100. Not SM121. It doesn’t error out — it falls back to Marlin weight-only FP4 paths instead of native FP4 tensor-core kernels. FlashInfer (the attention backend) also lacked SM121 support. The result: 40 tokens per second on the fallback path. The hardware has a fighter jet engine, and the software is feeding it regular unleaded.
On top of that, the official vLLM build shipped with CUDA 12.1a, which didn’t include the FP4 features the SM121 chip was built for. Updating to CUDA 12.1f unlocked the native path. A single CUDA sub-version was the difference between “Blackwell running as a fancy Ampere” and “Blackwell running as Blackwell.”
The problems and the path to fixing them are documented in the NVIDIA developer forum thread that became the community’s working space for this hardware.
The Community Fix
The napkin math said it should be much higher: 273 GB/s bandwidth ÷ 2.55 GB per token pass = ~107 tok/s theoretical. Getting 40 meant 37% efficiency — something was broken in the software path, not the silicon. (See Appendix B for the full formula.)
The community understood the gap and fixed both problems — the SM121 fallback paths and the missing CUDA FP4 support.
Christopher Owen wrote custom CUTLASS kernels — both for attention and for block-scaled FP8×FP4 MoE GEMMs — specifically targeting SM121. He then quantized the dense projection layers (QKV, output, lm_head) to MXFP4 and enabled FP8 KV cache support. The result: a vLLM Docker image specifically tuned for DGX Spark (github.com/christopherowen/spark-vllm-mxfp4-docker). Same model, same hardware — 60 tokens per second on a single Spark.
eugr identified that FP4 kernels were better optimized for SM120 than SM121 and pointed to SGLang’s branch optimizations as a reference. He built a dual-Spark vLLM Docker setup (github.com/eugr/spark-vllm-docker) — add a second node: 70 tokens per second. His repo also includes recipes for running various models on the Spark.
The Wrong Question
60 tokens per second is good. It’s usable. But if the hardware is this capable, what happens when you stop treating it like a single-user chatbot?
Every reviewer had tested single-user latency. The GPU was sitting at minimal KV cache utilization at normal load. It wasn’t slow — it was bored. Nobody in the official review circuit even thought to check.
What Concurrency Actually Means
This isn’t a chatbot machine. It’s an agentic coding substrate. Multiple agents firing simultaneously, parallel tool calls, hundreds of small context chunks processing at once — single-user latency is the wrong question entirely. The right question is concurrency.
vLLM doesn’t just serve one request faster. It batches hundreds of requests simultaneously, packing them into GPU memory dynamically. That’s the whole point.
Community Tuning
The best configuration for gpt-oss-120b wasn’t in any official docs — it came from community experimentation, documented in the forum thread. The winning setup:
vllm serve openai/gpt-oss-120b \
  --quantization mxfp4 \
  --mxfp4-backend CUTLASS \
  --mxfp4-layers moe,qkv,o,lm_head \
  --attention-backend FLASHINFER \
  --kv-cache-dtype fp8 \
  --gpu-memory-utilization 0.70 \
  --max-model-len 131072 \
  --max-num-seqs 2 \
  --max-num-batched-tokens 8192 \
  --enable-prefix-caching
Key choices: MXFP4 quantization applied selectively (MoE, QKV projections, output, lm_head). FP8 KV cache. FLASHINFER attention backend instead of the default. 131K context length with only ~3% slowdown from 512 to 8192 tokens. MoE GEMM dominated decode latency at 61%, followed by attention at 20%.
I used this command to verify my setup was correct and reproducing the same benchmark results the community reported. The gpu-memory-utilization 0.70 is a safe value when running other Docker containers on the same hardware — leaves headroom for coexistence. For dual-node, the same config applies with --tensor-parallel-size 2.
The Payoff — 3,975 t/s
Someone in the forum thread fired 1024 concurrent requests at gpt-oss-120b. Not a typo. One thousand twenty-four simultaneous prompts. Total token throughput: 3,975 tokens per second. The thread exploded. People thanking each other for “unlocking” hardware they’d owned for months.
The tradeoff is clean — total throughput scales while per-request latency grows predictably:
| Concurrency | Total tok/s | Output tok/s | Mean TTFT | Mean ITL | Mean E2E |
|---|---|---|---|---|---|
| 1 | 451 | 49 | 304 ms | 18 ms | 2.5 s |
| 4 | 936 | 102 | 96 ms | 39 ms | 4.9 s |
| 16 | 1,918 | 207 | 191 ms | 76 ms | 9.5 s |
| 64 | 4,158 | 444 | 322 ms | 131 ms | 16.4 s |
At 64 concurrent requests, total throughput hits 4,158 tokens per second — the hardware is finally working. Per-request latency goes up, but for agentic workloads running dozens of parallel calls, total throughput is what matters.
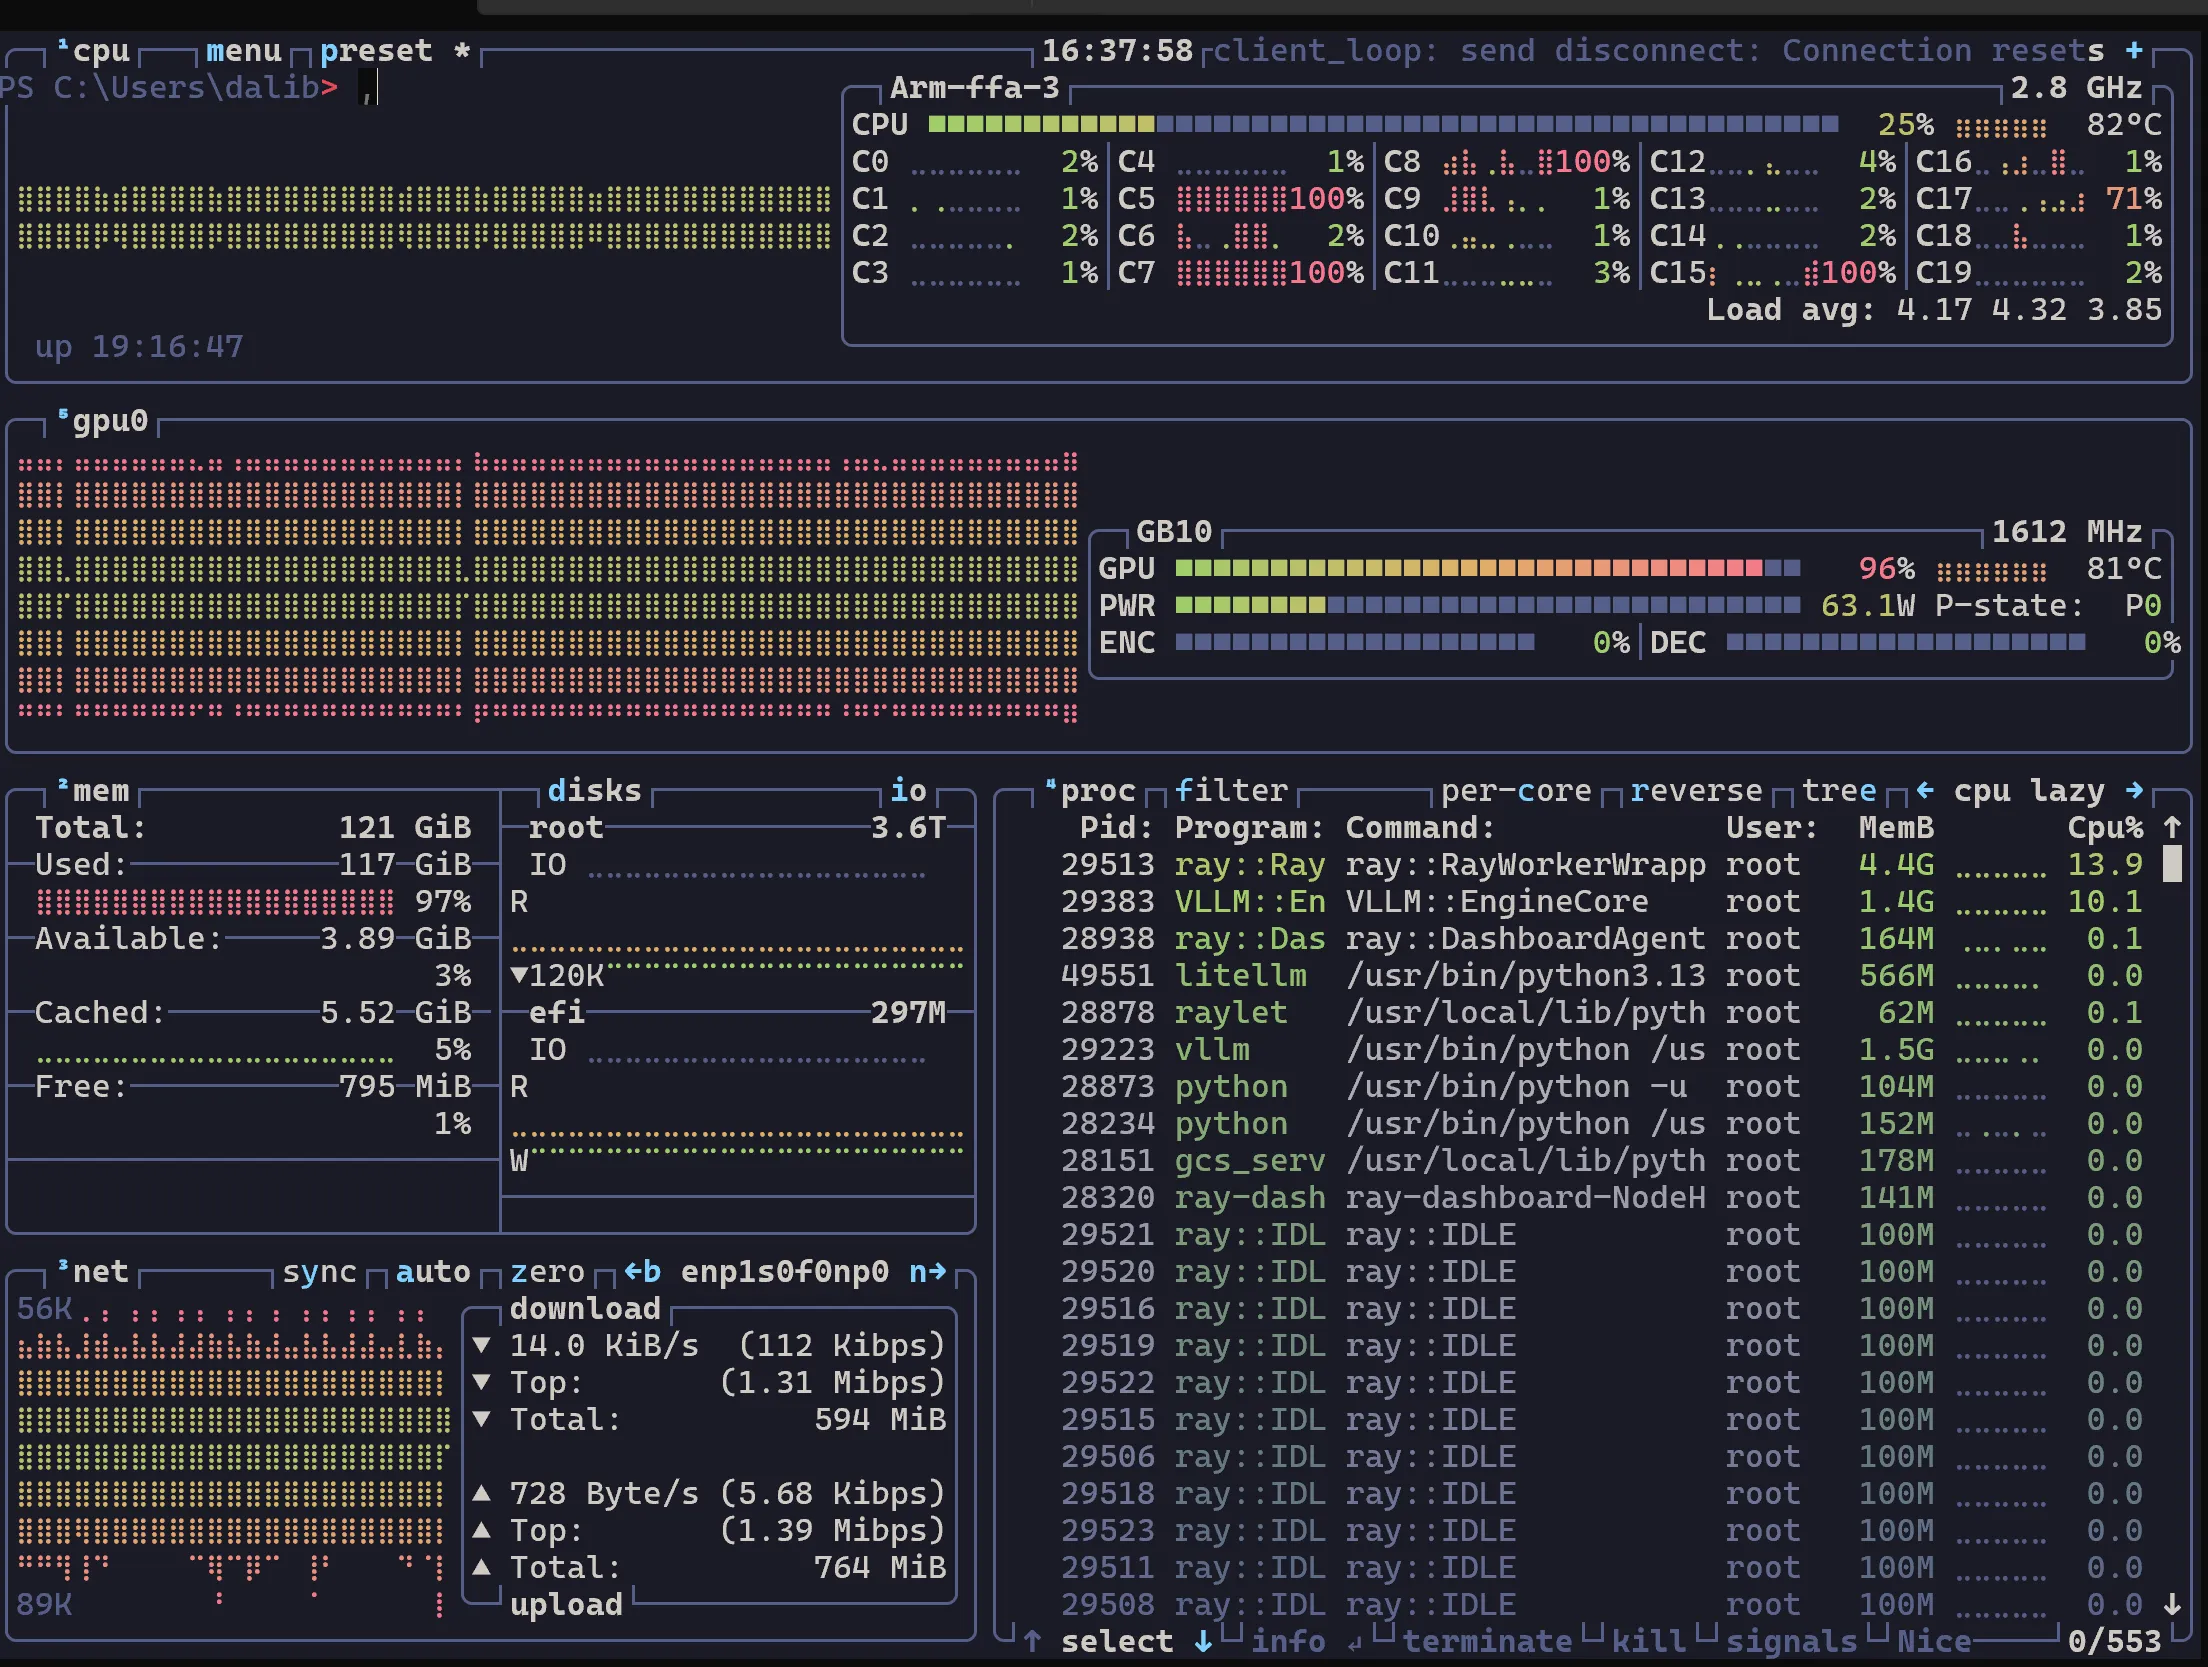 GPU utilization under concurrent load — this is what the hardware looks like when it’s actually working.
Full benchmark breakdown (all concurrency levels, percentiles, methodology) in Post 4.
The Takeaway
The NVIDIA playbook gave us 40 tokens per second. The community found the SM121 fallback paths, fixed the CUDA version, added native MXFP4 support, and hit 3,975 t/s. This is what “bring it home and listen” sounds like — 40 t/s on the spec sheet, 3,975 t/s when you actually run it. The hardware was never the bottleneck — the software stack was.
Next: Benchmarking Reality: llama-benchy and the Spark Arena — we claimed big numbers, now under the microscope.